This page is used to introduce the advantages of using high resolution model to support
modeling team’s Phase II tasks.
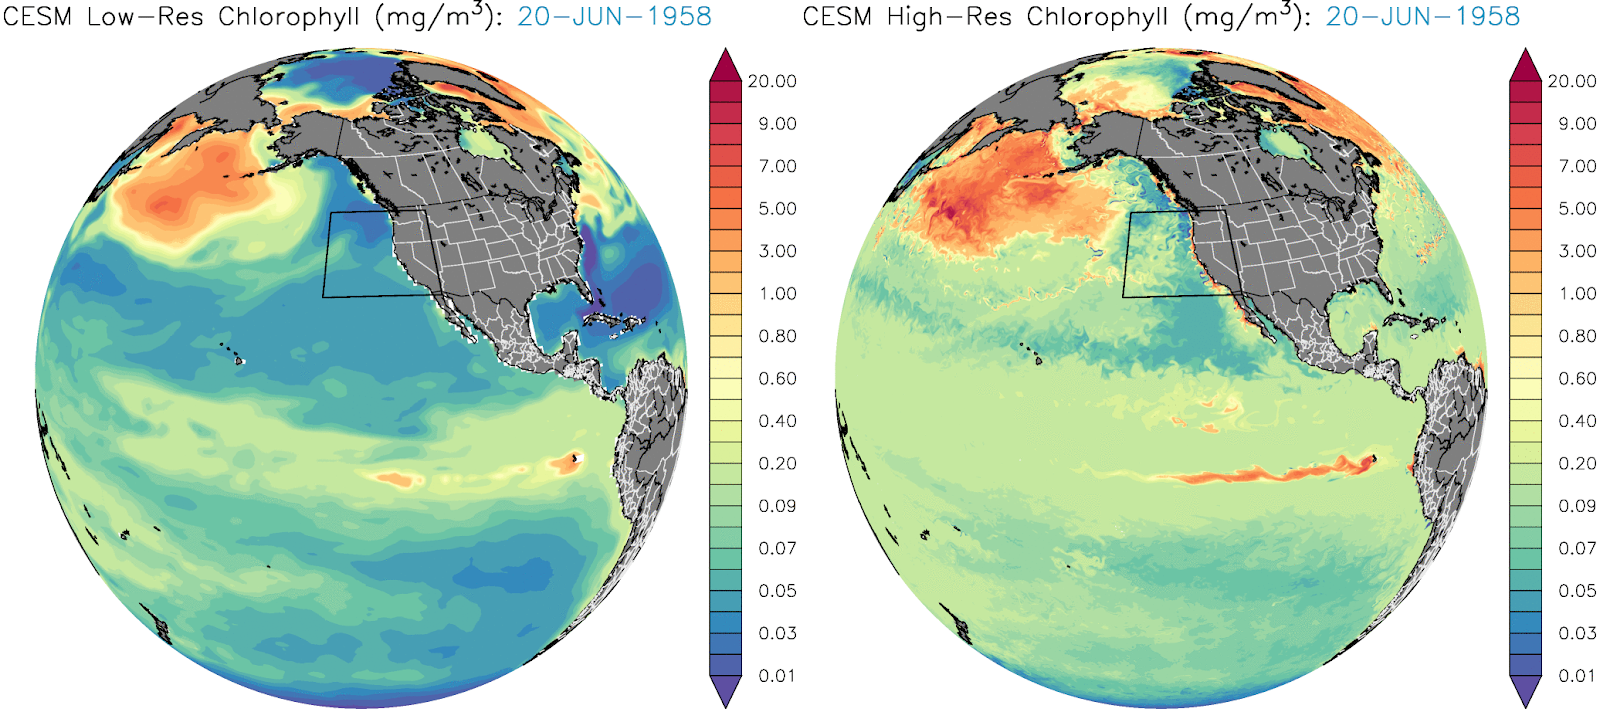
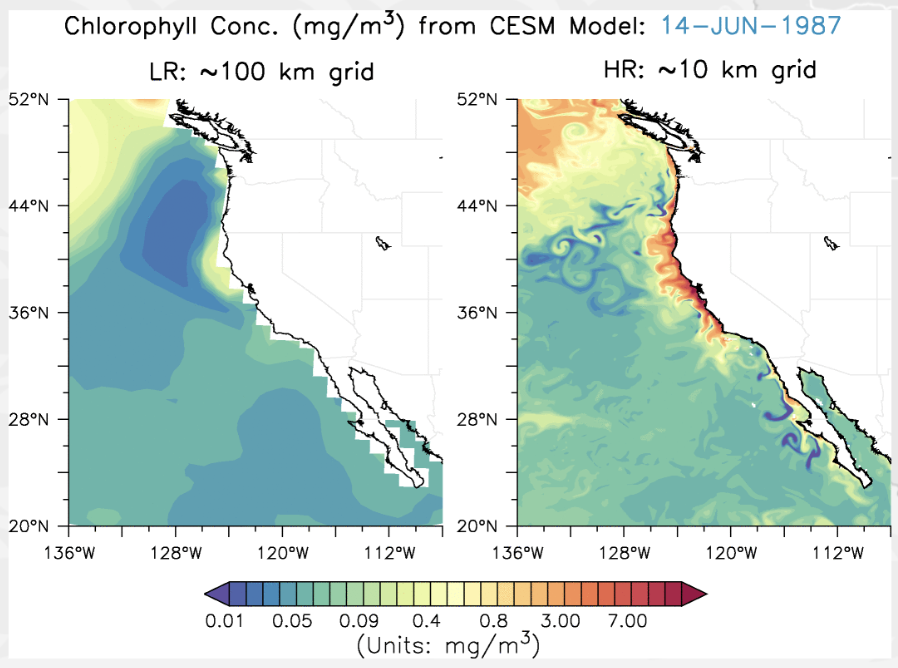
Animation of Chlorophyll concentration from low-resolution (LR) and high-resolution (HR) models during 1987
Note: HR data is only available till 1991 but that for LR is available till 2020. The mid-March to mid-November period shows very fine-scale features in the HR case.
Chlorophyll concentration from LR case in a different projection. These type of plots/movies will help to demonstrate that the model is a global model, without the typical drawbacks of regional models (eg. EcoCAST).
This Animation shows the capability of our HR configuration in resolving near-coastal fine scale processes. The sea surface temperature (SST) in the first panel is cooler near the coast during the upwelling season (May-Sep).
A view of the anomalies in model fields during 2014-2015 Marine Heat Wave (the blob). Monthly data is used here.
SST field clearly shows the warm anomalies associated with the blob (compare 2014-Sep with that in here).
Low-resolution model is not able to reproduce fine-scale features in chlorophyll distribution and mechanisms that control them.
Note: There are differences between how these two versions of the models are set-up and run. So this is not an apples-to-apple comparison.
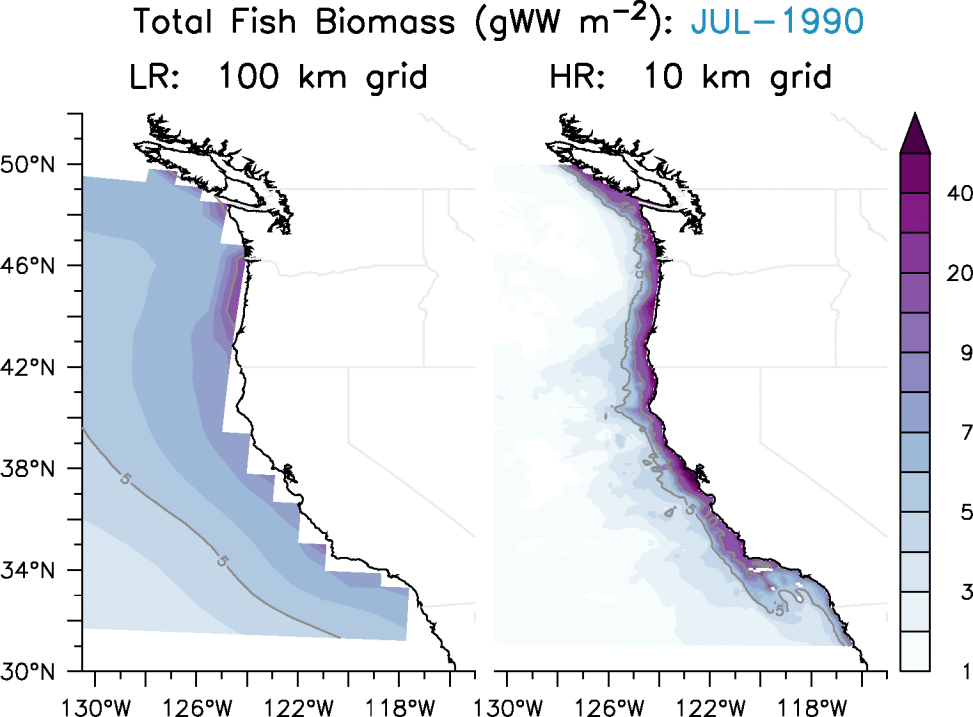
Fisheries predictions for the California Current System
BGC predictions for the California Current System in June 1987
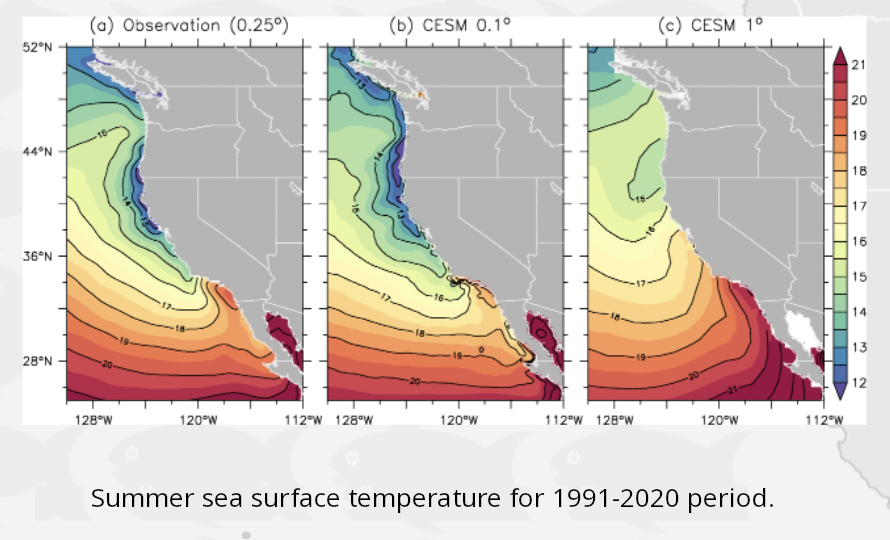
Climate predictions for the California Current System
Summer Sea Surface temperature for 1991-2020 period
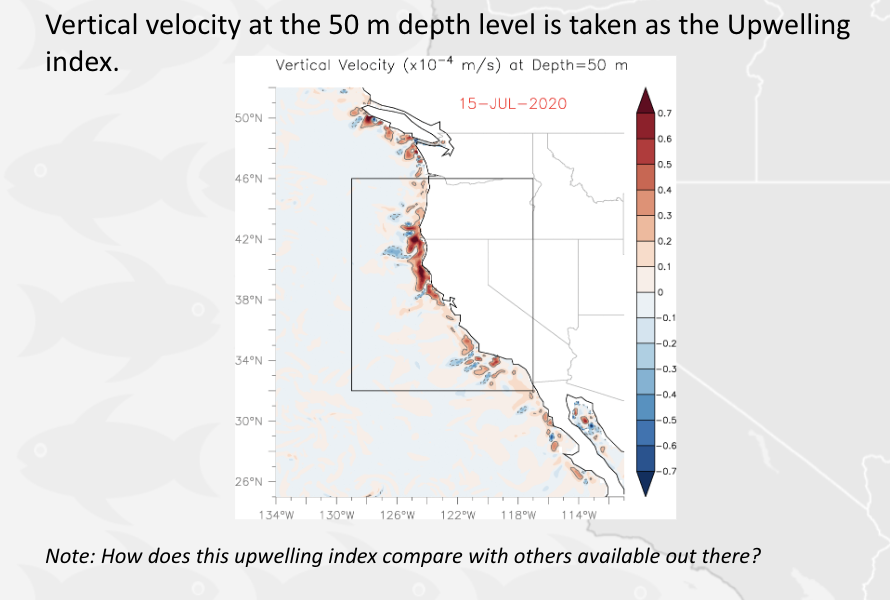
Upwelling index prediction for the California Current System
Vertical velocity at the 50 m depth level is taken as the Upwelling index.